

Learn how to plan a successful nonprofit fundraising event from start to finish, including goals, budgeting, sponsorships, promotion, donor management, event-day logistics, and follow-up.

Donor retention is key to predictable fundraising revenue. Discover 10 practical strategies nonprofits can use to build stronger, lasting donor relationships.

Learn how nonprofit membership management helps organizations track renewals, payments, communications, and engagement, and how DonorView brings it all together in one platform.

Golf tournaments are a popular fundraising event for nonprofits because they combine donor engagement, sponsorship opportunities, friendly competition, and community building into one experience.
What Is Donor Management Software? A Complete Guide for Nonprofits - 2026
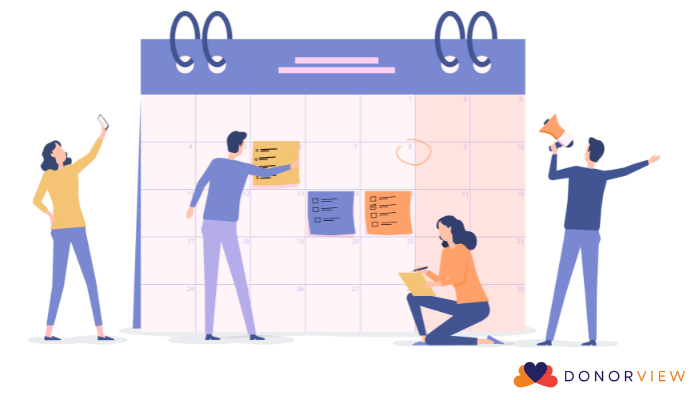
In our last blog post we talked about strategic planning and how DonorView can help you with this long range planning process. In this post, we will focus on annual planning. Your annual plan: Uses the strategic plan as a guide to give you overall focus Is limited to just the calendar or fiscal year Creates action steps to accomplish goals Assigns responsibilities to perform those actions Measures definitive results on a regular basis Your annual plan will include a financial goal for the year, and it will be broken down into sub-goals for different revenue streams. For example, your fundraising activities might include a couple of events, a membership program, major donor solicitations, corporate donors, and small gift donors. Within each of these revenue streams, you will make a smaller goal to feed into your overall annual goal. You can compare previous performance in these areas by producing reports from DonorView. If your gala event last year took in $100,000 in revenue, but cost $20,000 to produce, you can look at opportunities to either reduce costs or increase revenue. Can you increase ticket prices? Can you invite more people? Can you get more sponsors? Can you change venues to something lower cost? All of these details are worked into your plan. If you plan to get more sponsors, who is responsible for this activity and when is this action due? If you had $25,000 in sponsorships last year, is it reasonable to increase this by 10%? You will also want to set up a few Key Performance Indicators (KPIs.) Your KPIs should be a mix of leading and lagging indicators. Lagging KPIs measure things that already happened like average gift size, number of gifts, total donations, and event attendance. They are historical in nature. Leading KPIs are rates or percentages that can help indicate what direction you are going. Things like donor retention rate, average donor growth, and average donation growth can help you predict if you will be increasing your fundraising or might see shortfalls. KPIs are also generated by creating reports in DonorView. The fundraising dashboard also shows me details like Five Year Giving Patterns and Donor Retention Rate for the last 12 months. Your annual plan will also need a reporting schedule. Depending on the KPIs you are tracking, some items might need to be evaluated monthly, while some might be able to be reviewed quarterly. Performing a regular evaluation on progress towards your goals will allow you to make adjustments as needed in case you are not reaching your desired targets. Adjustments are part of the overall planning process, and we know that what gets measured gets managed. Adjustments might include assigning more resources to get important activities accomplished or it might mean that some activity gets abandoned because the results did not materialize despite a lot of effort. Your annual plan might include goals beyond fundraising, too. Maybe you want to start a more regular communication plan with constituents, and you want to utilize the email marketing module to track open rates. Or you plan to start a moves management program and will start to use the interactions feature to track those activities. You might even intend to formalize your volunteer program with applications in the Surveys/Forms module, volunteer events, and volunteer scheduling features. Whatever the activities you want to undertake to move you closer to your organization’s ultimate vision, be sure to think about how you can utilize the features already available in DonorView to help you get there.
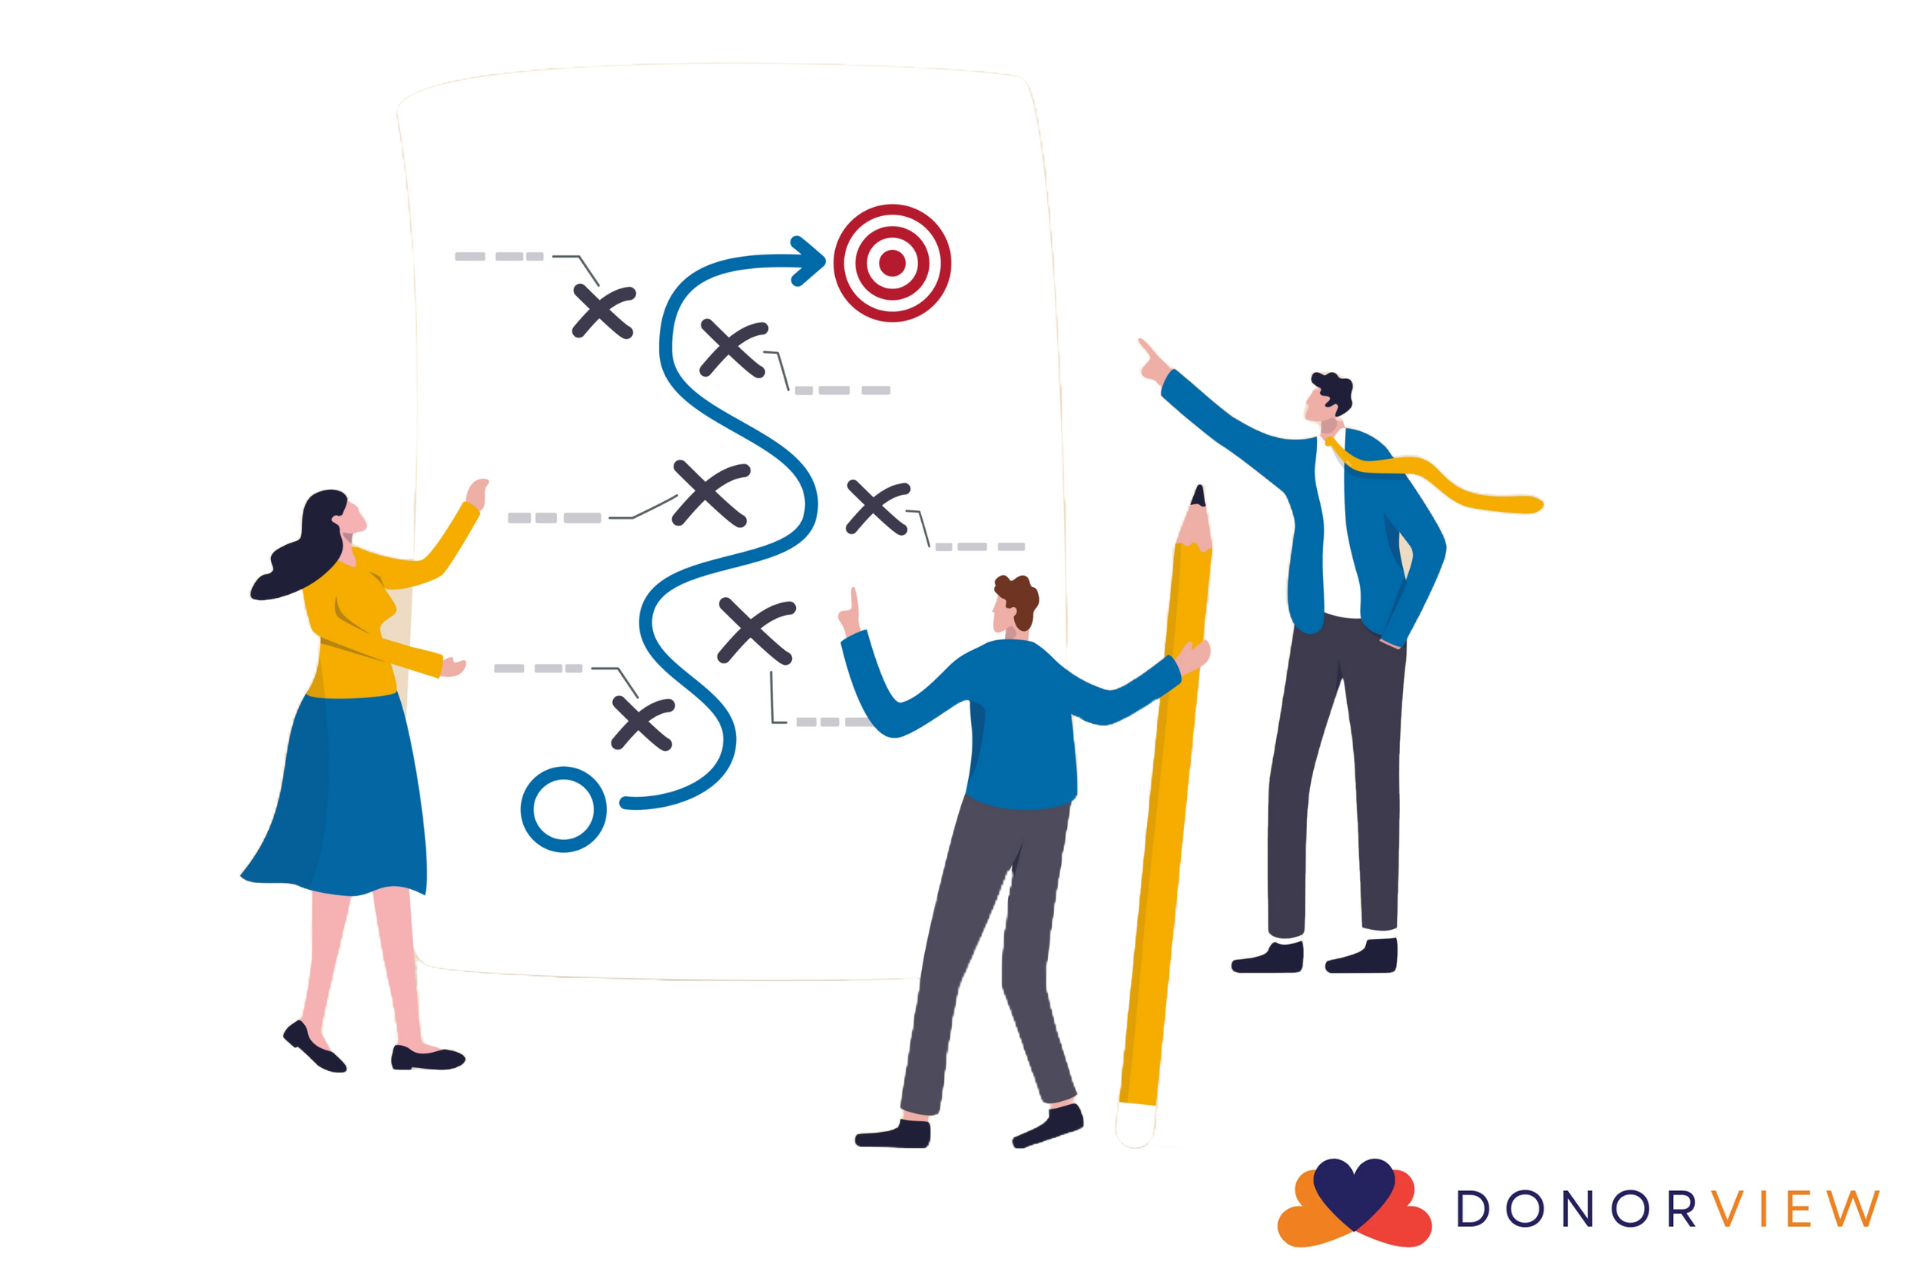
In our next few posts, we will be focusing on strategic and annual planning as well as how DonorView can help you with these processes. We start with strategic planning because the strategic plan sets the path you want to follow and ultimate long-term goal, whereas annual planning lays out the tasks that are performed to achieve the smaller goals set for each year. Strategic planning requires analysis of where you are and where you want to go. You look at what is happening internally within your organization as well as what is happening external. This is called a SWOT analysis, which stands for Strengths-Weakness-Opportunities-Threats. Strategic planning is usually performed by the leadership team and can take several weeks (or months) to complete. Strategic plans: Look at the big picture – the “why” Create a map to follow to stay organized and make sure everyone understands the priorities Focus on the long-term Incorporate your organization’s vision, values, and mission Examine external factors that influence your organization Use scenarios to evaluate the best course of action Identify major objectives to help achieve vision Are performed once every 3 – 5 years, but reviewed regularly You can utilize DonorView in your strategic planning process by using the software to provide the data you need for your analysis, in particular, your fundraising strengths and weaknesses. You can compare things like total amount raised, number of gifts received year to year, average gift size, number of new donors, and donor retention rates. You could also get more detailed information like comparing event proceeds or number of tickets sold. Comparing this data over a few years, you can get a snapshot of the direction you are heading to show if you are improving or seeing a negative trend. Then, you can take a look at some of the opportunities that DonorView has to offer to help you reach your goals. Perhaps one of your strategies is to improve communication with your donors, so utilizing the email marketing or texting features can help you in this area. Or maybe you want to start getting more corporate sponsors or grants, so integrating the Sponsorships or Grants features in the Fundraising module are tools you can start using. Lots of organizations also want to implement a donor engagement or moves management program, so features like Primary Relationships in the constituent’s profile or Follow Ups can be used to track and plan contact with prospects. Think about DonorView as an integral part of your analysis and planning process. Not only can it provide information on where you have been, it can also inform where you are heading and help you reach new goals.
Sponsorships are a great way to partner with industry leaders and businesses. The benefits are far more than financial, they also include expanding your reach and demonstrating social proof of your organization’s impact and value. The sponsor benefits as well not only through the exposure to your constituents, but also by connecting with organization’s that share their values, showing goodwill in the community, and providing opportunities for their employees to participate in meaningful activities. In order for the sponsor to see results from their involvement, your organization must deliver on all the benefits you offered. Before using DonorView, you probably kept a spreadsheet with the names of your sponsors and a list of items you needed to provide or do for that sponsor. You had to manually update it with new sponsors and keep track of when items were complete. With DonorView, you can assign sponsorships and track deliverables right within the software. In the Transactions & Invoicing Module using Sponsorships, you can create different sponsorship levels, assign tasks to those levels, and automatically assign follow up activities for specific users. In the Events and Membership pages, you can link sponsorships to specific levels and as soon as a transaction is recorded for that level, the follow up tasks are automatically assigned. Sponsorships can also be linked to general transactions and pledges. When entering or updating a transaction, there is a link to sponsorships and just like memberships and events, once that transaction is saved, the sponsorship task assignments are automatically created. For a golf tournament sponsorship deliverables might include things like a foursome, banner at the event, social media posts, two tee hole signs, the company’s logo on the event t-shirt, a video message played at the event, a full page ad in the program, and a feature article in the nonprofit’s newsletter. These activities might be performed by several different staff members, so you are able to link the specific staff member to the task using the Follow-ups feature. Each staff member will be able to track their own tasks via My Follow Ups and you can see all the tasks (or deliverables) for all the sponsorships in the Transactions & Invoicing Module on the Sponsorships page in the Manage Follow Ups grid. Like all grids you can create, save, and share views using the filters and sorts on the columns. You can edit each activity to show when it was completed, by whom, and any comments associated with completing the task. With the Action menu, you can even export to Excel if you really miss having that spreadsheet! The software also offers other features to stay in touch with your sponsors like automatic emails for event and membership purchases, text and email messaging prior to and during events, and auto post-event thank you emails. You want your sponsors to know that you delivered all the benefits promised, the impact of their sponsorship on your organization and any fundraising efforts, as well as the reach of their sponsorship with attendee numbers and other statistics. The sponsors can use this information to demonstrate the advantages of your long-term partnership. If you want your sponsors to come back year after year, you have to be organized and able to demonstrate the value. Having all the information within the CRM allows everyone on your team to have access to up to date information, contact information for any of the sponsors is just a click away, and individual staff members can see their assignments in one place which makes it easier to keep track of tasks and manage your work and show those sponsors they really are getting a lot of bang for their buck.
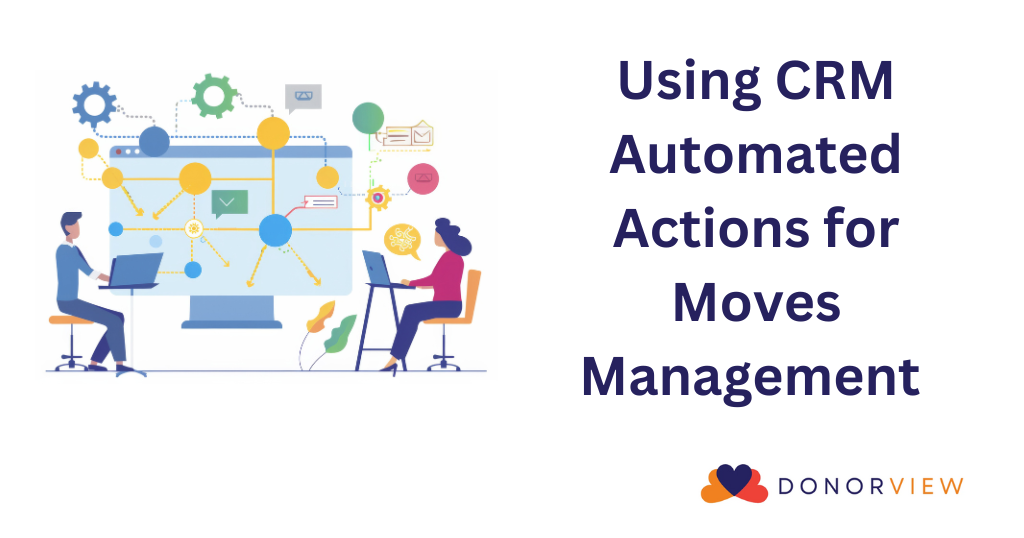
Welcome to our new blog series “Making the Most of DonorView” where we will bring you tips and suggestions about using the tools in DonorView to enhance your fundraising programs. Our goal is to help you understand how to apply the features in the software to your existing workflow as well as show you some new ideas to consider adding to your process. In this post we invite you to delve a little deeper into the Automated Actions feature in the CRM Module. Automated Actions let you send internal and external notifications when a constituent reaches a certain milestone called a “trigger” in the database. Triggers can include things like a first time gift, a cumulative giving amount, a single gift amount, or even a total number of gifts. For example, you can be alerted automatically when someone makes a donation of $1,000 or more, or they make their 10 th donation, or their lifetime (cumulative) giving has reached at least $5,000. While all of this information is also easily gathered on the Constituents Grid by adding a filter, the Automated Actions feature can go a few steps further. Along with the internal notification to you and your fundraising team, you can also automatically assign follow-ups, assign the constituent to a constituent category, and even send the constituent an email message. If we use our lifetime giving total of >/= $5,000 again, we could add a follow-up for the development director to call the donor and thank them, assign that donor to a “Major Donor Prospect” constituent category, and send a warm thank you email to the donor letting them know how much their giving has impacted your community. And you only need to set up the Automated Action once and enable it to allow these activities to happen automatically each time a constituent reaches the milestone. For organizations with a donor engagement or move management program, these automated actions allow you to recognize potential prospects in real time. Not only are timely acknowledgements of individual gifts important to donors, recognizing commitment to your cause is also appreciated. Tracking things like repeat donors and longevity also reveal excellent prospects for legacy and planned gifts. You can learn more about the Automated Actions feature in our knowledgebase articles or reach out to the support team with questions. Stay tuned for next blog post when we take a look at managing sponsorships for events and fundraising campaigns with the Sponsorships feature in the Fundraising Module.
Save the date for November 29, 2022. GivingTuesday is quickly approaching! If you haven’t started preparing already, it’s time to get yourself on track for this proven successful day of giving. Some of you may be asking: Is GivingTuesday even worth participating in? The short answer is YES! See for yourself and check out these stats below from the GivingTuesday 2021 Impact Report.